The overview part of the analytics allows you to understand in one click the main KPIs and information of your experience.
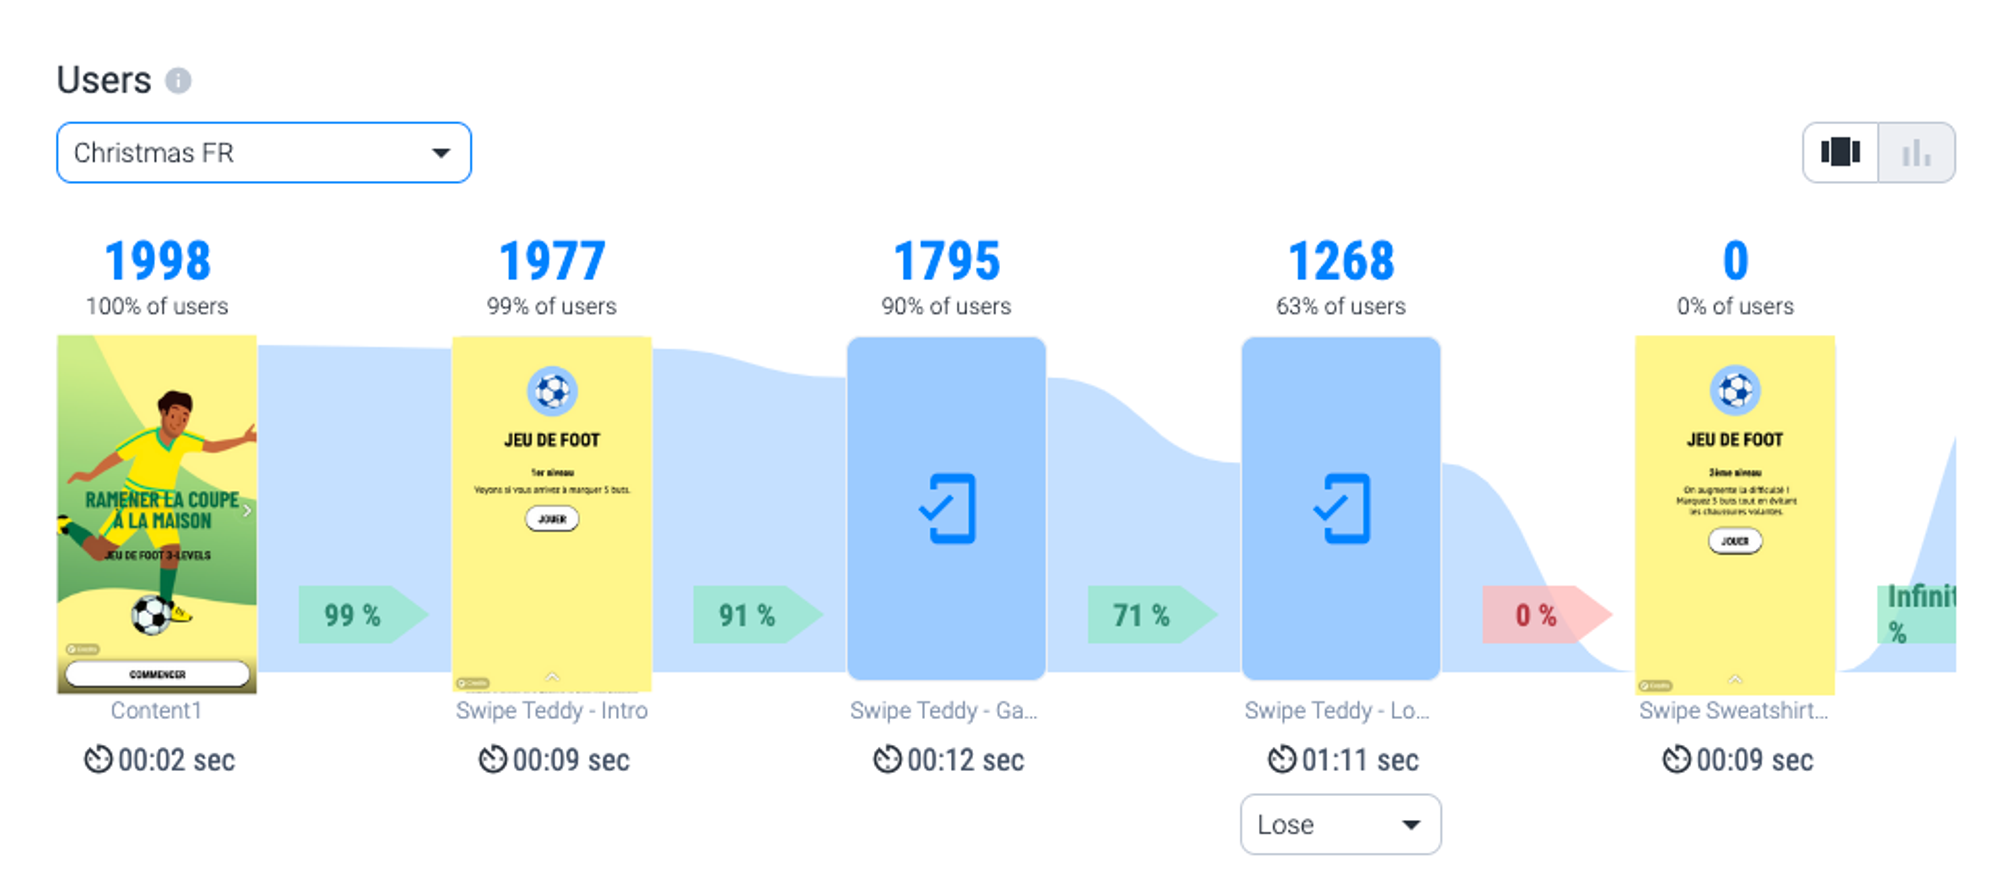
Users
On this bar graph you'll find the number of views per screen of your experience.
Users per device
Do the users landing on your experience use their mobile or computer?
.png?table=block&id=123c0607-cf06-442d-8cdf-ac29b94f8546&cache=v2)
Users per source
What are the sources generating the most traffic on your experience?
.png?table=block&id=c25bebd0-30cd-43f8-b246-dac94a4a8289&cache=v2)
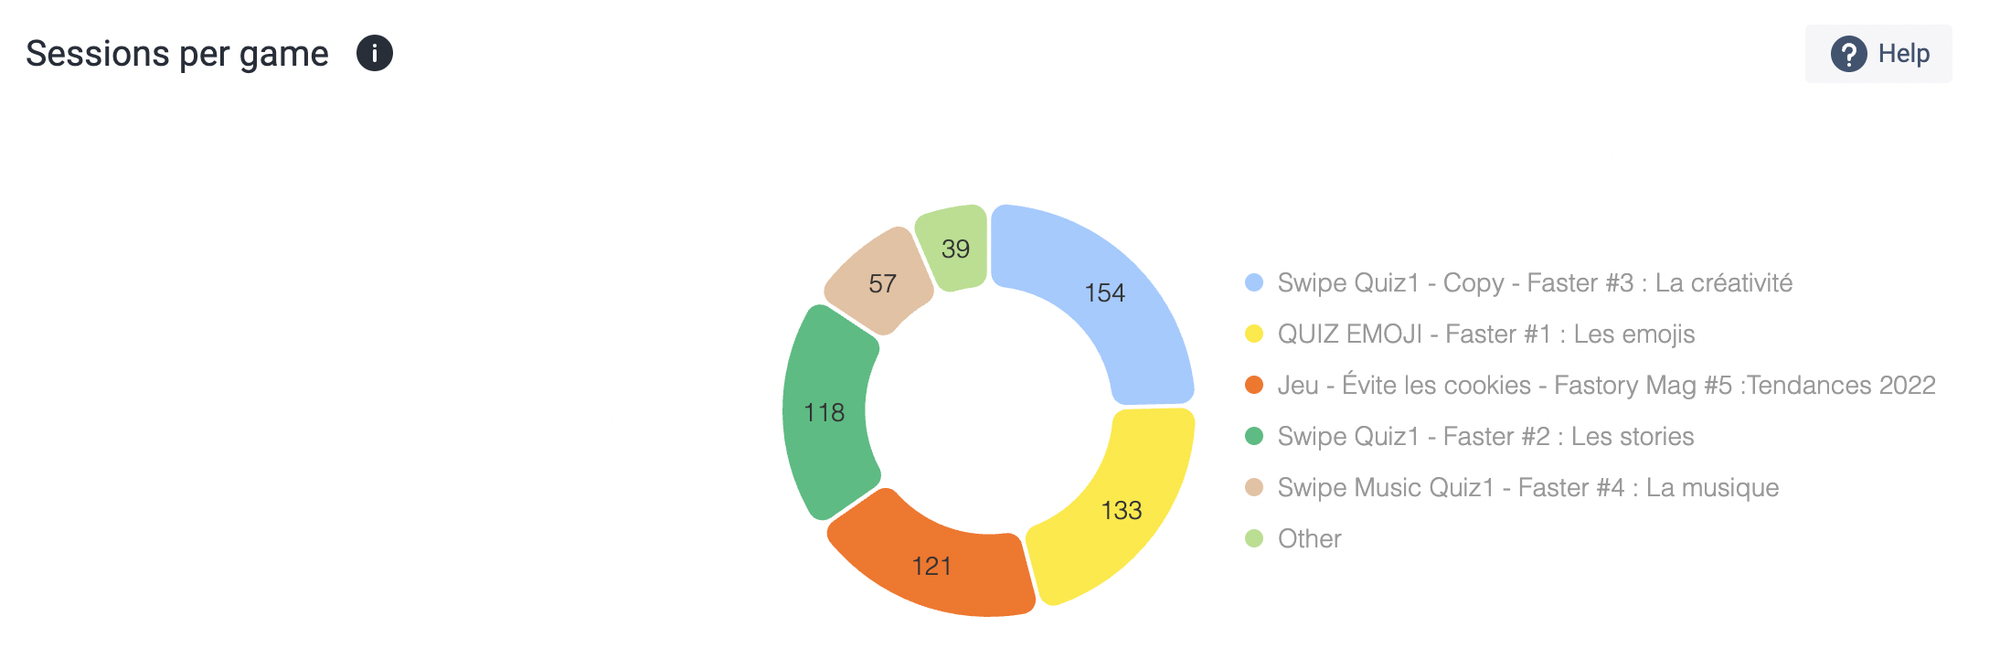
Sessions per game
How many times a game has been played in total.